 AIMS
AIMS AIMS-H Long Focus
 Farsightâą System
 Riegl VQ-1560i
 Riegl VQ-780II
 UltraCam Eagle M3
 Y-1 VTOL UAV
 Aerial Acquisition
 UAV Acquisition
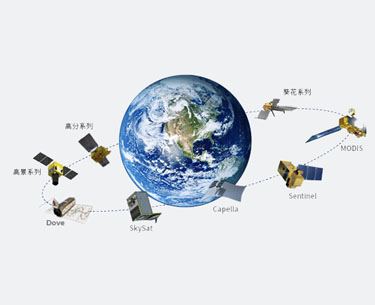 Satellite Acquisition
 Field Acquisition
 Integrated
 LiDAR
LiDAR Orthophoto
 DEM
DEM DTM/DSM
 3D Mapping
 Topographic
 Infrared
 Feature Extraction
 BIM
BIM Transportation
 Water
Water power
power  Forestry
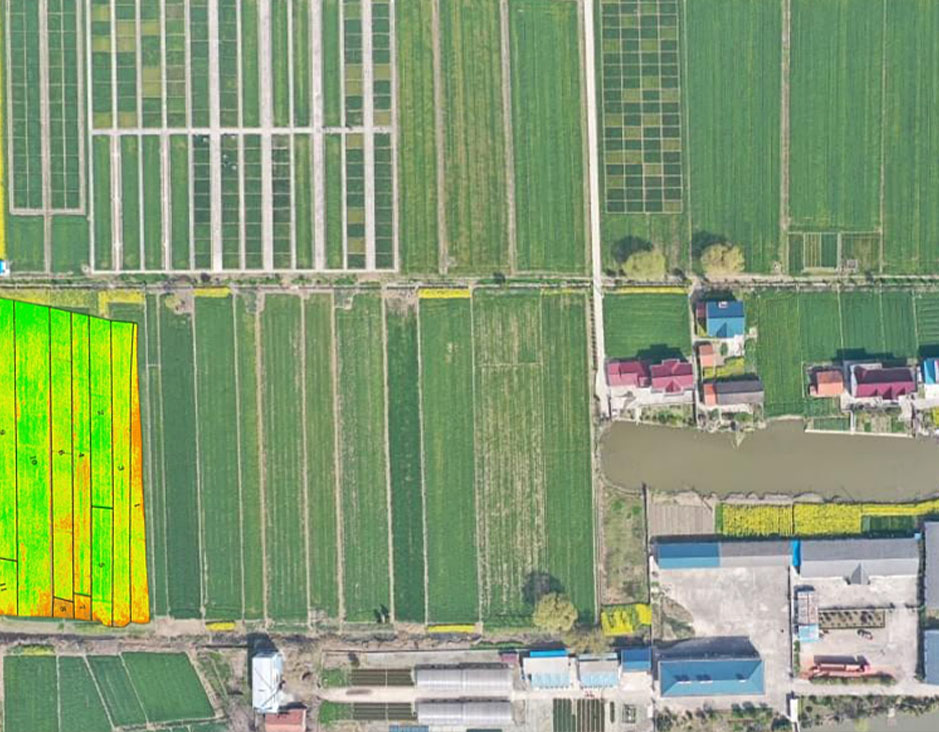 Agriculture
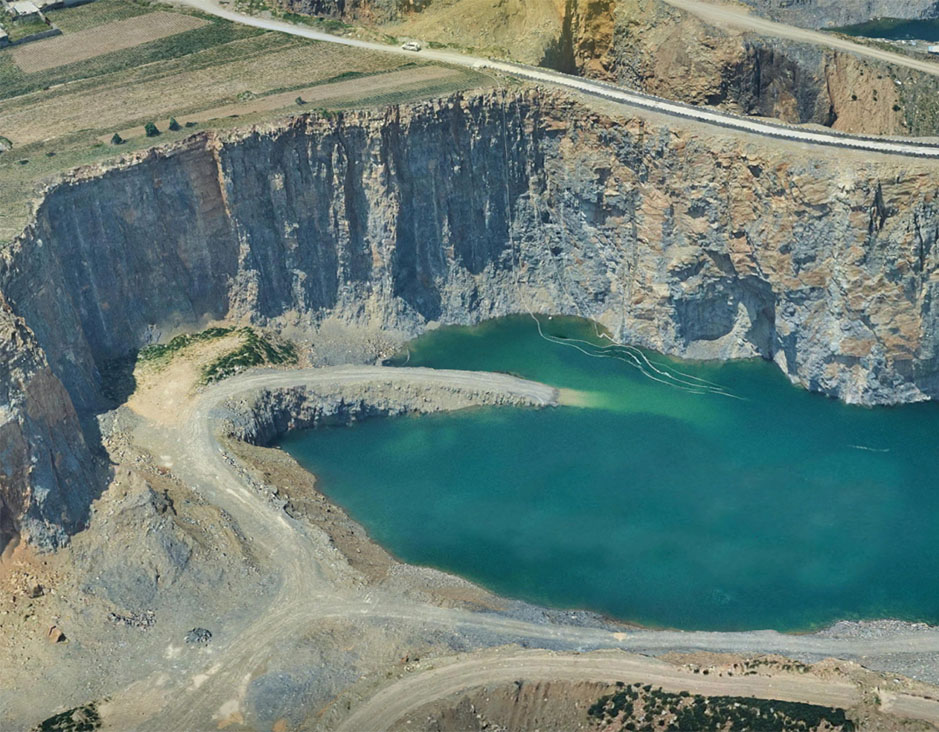 Mines & Quarries
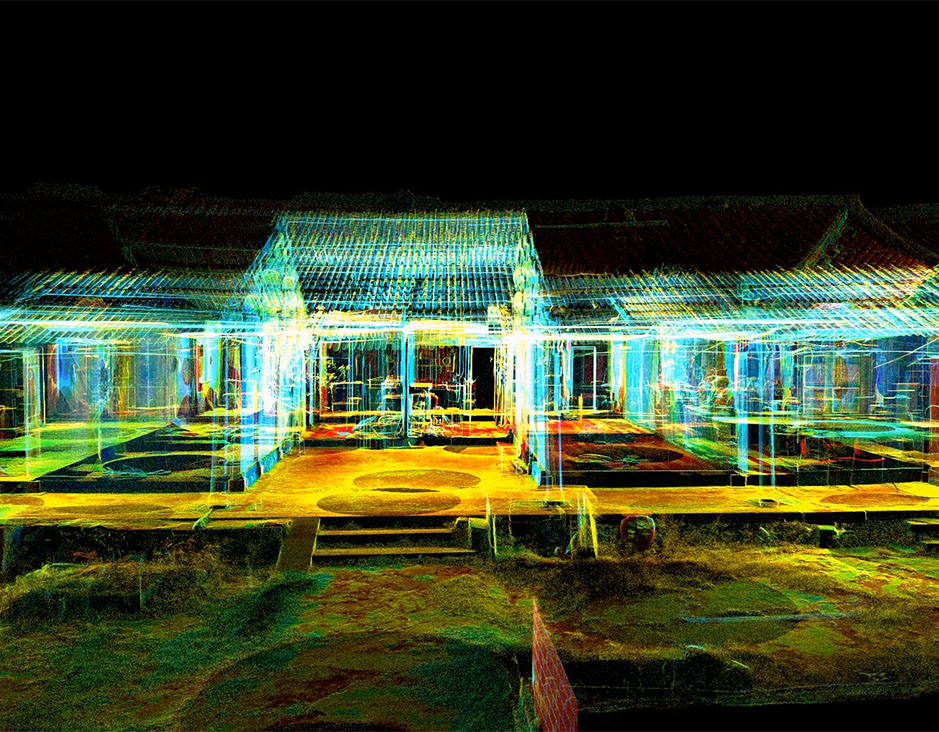 Heritage Buildings
 About feiyan
 Recognition
 Cases
Cases

search


How does Satellite Imagery in Farming work?
Jun 29, 2022
Letâs start by understanding how satellite imagery in farming works before tackling the actual benefits of this technology. If you arenât interested in the technical details and only want to read about the potential upsides, then skip ahead to the next big section.
Satellite technology has been around since 1957 and the first earth-observation satellite (Landsat 1) was launched in 1972. We now have more than four decades worth of images of the earth. Constantly evolving camera technology now produces better, high-resolution images for the public.
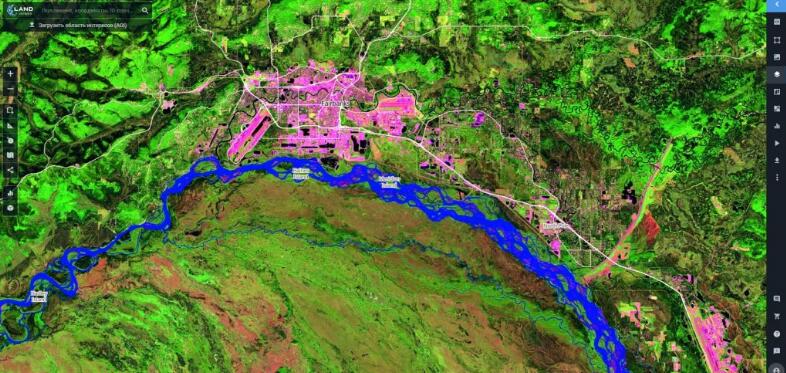
Precision agriculture uses satellites to capture multiple types of light spectrums beyond the usual visual light (VIS). Letâs first take a look at which spectrums are commonly used!
Different Types of Satellite Spectroscopy:
One valuable Aspect of Satellite Imagery is the use of channels beyond the standard Red, Green, Blue. This helps to Highlight relevant information and reduce the impact of disruptive factors (like clouds).
VIS â visible light

VIS is the most common type of satellite imagery. Itâs exactly like your google maps satellite option and shows the location from a birdseye view. Using this type of spectrum will visualize the earth and vegetation in mostly the same way youâd see them from an airplane.
NIR- near-infrared

This spectrum captures the reflected infrared light and helps to Highlight Vegetation. The near-infrared Spectrum can be found at a Wavelength between the upper 0,7ÎŒm to around 1,2ÎŒm. Healthy Plants with ample Chlorophyll have a higher Reflectance Rate (Darker Red) compared to stressed plants (lighter Red). Furthermore, Soil comes in a variety of brown tones, and clouds/snow appear white. Clearwater appears in dark blue and dirty brown water in cyan colors.
SWIR â Short-wave infrared

Short-wave infrared includes light on a wavelength between 1,1ÎŒm â 3 ÎŒm. This spectrum is primarily used to measure the water concentration in soil and plants. According to Mohamed et al. and Nasa, water absorbs SWIR light at a wavelength around 1,4/1,9/2,4 ÎŒm. This layer builds the foundation of the NDWI!
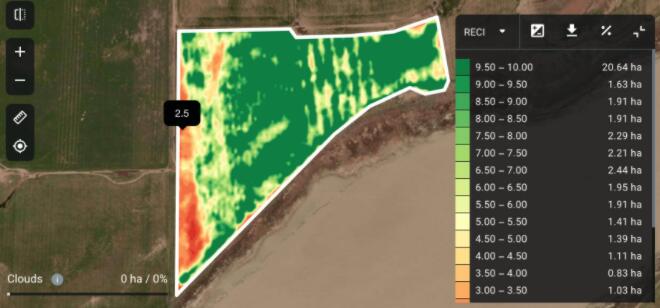
NDVI â Normalized Difference Vegetation Index

The NDVI plays a vital role in agricultural satellite imagery and helps to showcase differences in plant health over a whole field. To calculate NDVI, we use this formula (NIR â RED)/(NIR + RED), where RED is the reflected red range of the spectrum.
NDVI builds the backbone of satellite-managed farming, as itâs used to show where external inputs (fertilizer, water) are needed and which parts of the field are thriving. This data can also be used to make long-term decisions about crop rotation, soil management, and more.
NDWI â Normalized Difference Water Index

The NDWI or NDMI (Normalized Difference Moisture Index) finds application in the management of water stress in crops and soil. Long-term exposure to excessive amounts or lack of water can lead to yield reduction and plant death â The Normalized Difference Water Index is calculated with the following Formula: (NIR-SWIR)/(NIR+SWIR), where SWIR is set to a point in which water absorbs most of the reflection.
TIR â Thermal Infrared

Thermal Infrared (TIR or LWIR) includes wavelengths between 8,0-15,0 ÎŒm and in the context of satellite imagery, TIR helps to visualize temperature distribution. This spectrum is often depicted in grayscale but can also be color-coded. LWIR is mostly emitted and not reflected, which makes it possible to measure Thermal Infrared without the presence of the sun. Furthermore, TIR can also indicate the amount of water a plant uses by analyzing the temperature difference in fields caused by evapotranspiration.
SAR â Synthetic Aperture Radar

One of the recent developments in Satellite Observation Technology is Synthetic Aperture Radar, which for example can help to measure crop yields. The Wavelength of Radar Systems ranges from 0.04 inches (1 millimeter) to more than 62 miles (100 kilometers) and uses the reflection of pulses to calculate an accurate image of the surface below. SAR is not affected by clouds, making it an excellent supplementation to VIS and NIR.


-
 Jun 17, 2022
Satellite Technologies For Plant Nutrient Deficiency Identification And Treatment
Satellite Technologies For Plant Nutrient Deficiency Identification And Treatment More > -
Jun 22, 2022
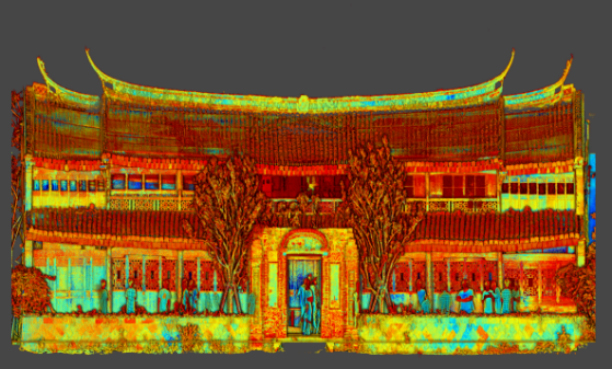
Historical Building Surveying and Mapping
China will further step up efforts to safeguard and transmit historical and cultural heritage as part of ongoing urban and rural development strategies. More > -
Mar 22, 2022
Utility of oblique aerial photography
With the rapid development of China's social economy, the value of real estate is increasing accordingly, which makes the country pay more and more attention to real estate surveying and mapping, and the requirements are higher and higher. More > -
Mar 22, 2022
What is tilt photography?
Tilt photography is a new and high technology developed in recent years in the field of international Remote sensing surveying and mapping. By carrying multiple sensors on the same flight platform and collecting images from different angles such as vertical and tilt, more complete and accurate information of ground objects can be obtained. More > -
Mar 22, 2022
Feiyan Remote Sensing LiDAR aerial photography project accumulates over 100,000 square kilometers
At present, airborne LiDAR technology has made great progress and has been widely used in many fields. Following the trend of technology development, feiyan Remote sensing has long been in the forefront of the industry. More > -
Mar 22, 2022
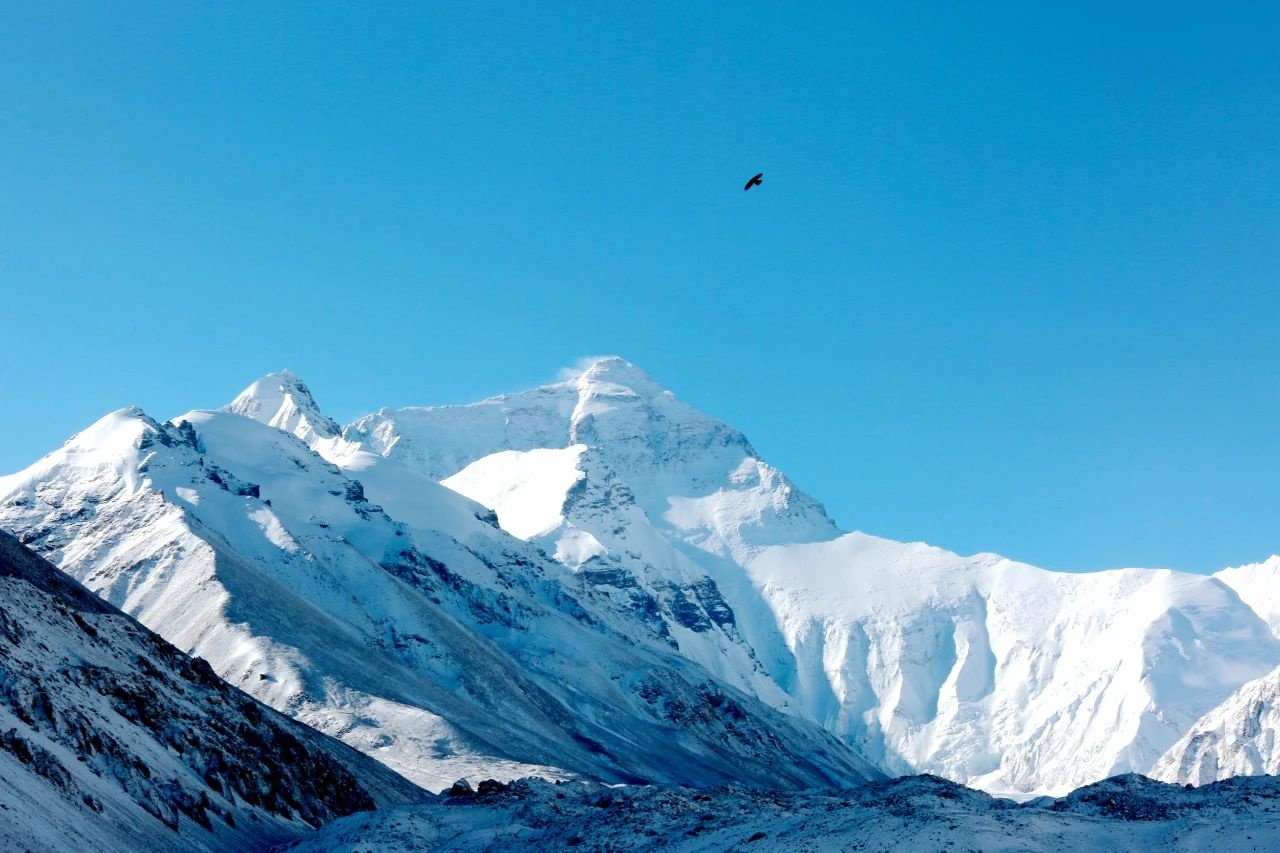
Mount Everest Elevation Measurement in 2020
On the afternoon of April 30, the first press conference of the 2020 Mount Everest elevation measurement was held at the Everest Base Camp, and the 2020 Mount Everest elevation measurement was officially launched. More > -
Mar 22, 2022
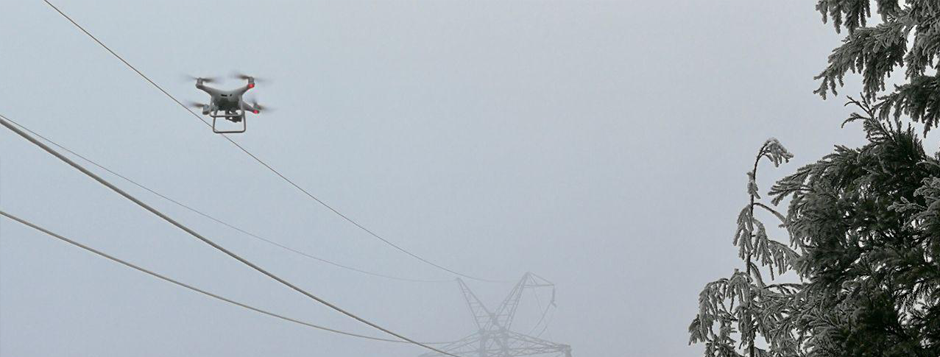
What are the restrictions on drone aerial photography?
Compared with traditional Aerial photography, the low efficiency of UAV Aerial photography has become one of the main bottlenecks restricting its development. More > -
Mar 22, 2022
The 6th Jiangsu University Surveying and Mapping Geo-Information business plan competition achieved
The 6th Jiangsu University Surveying and Mapping Geo-Information business plan competition achieved full success last week. Feiyan Remote sensing participated in this event as one of the chief co-sponsors. The competition provides an excellent platform for our students, played a major role in cultivating talent of Surveying and Mapping Geo-Information application as well. More > -
Mar 22, 2022
7 Ways to Process LiDAR Data
LiDAR technology has given the spatial data industry some of the largest data volumes weâve ever seen. Most point clouds Iâve worked with have been tens of gigabytes in size. More >