 AIMS
AIMS AIMS-H Long Focus
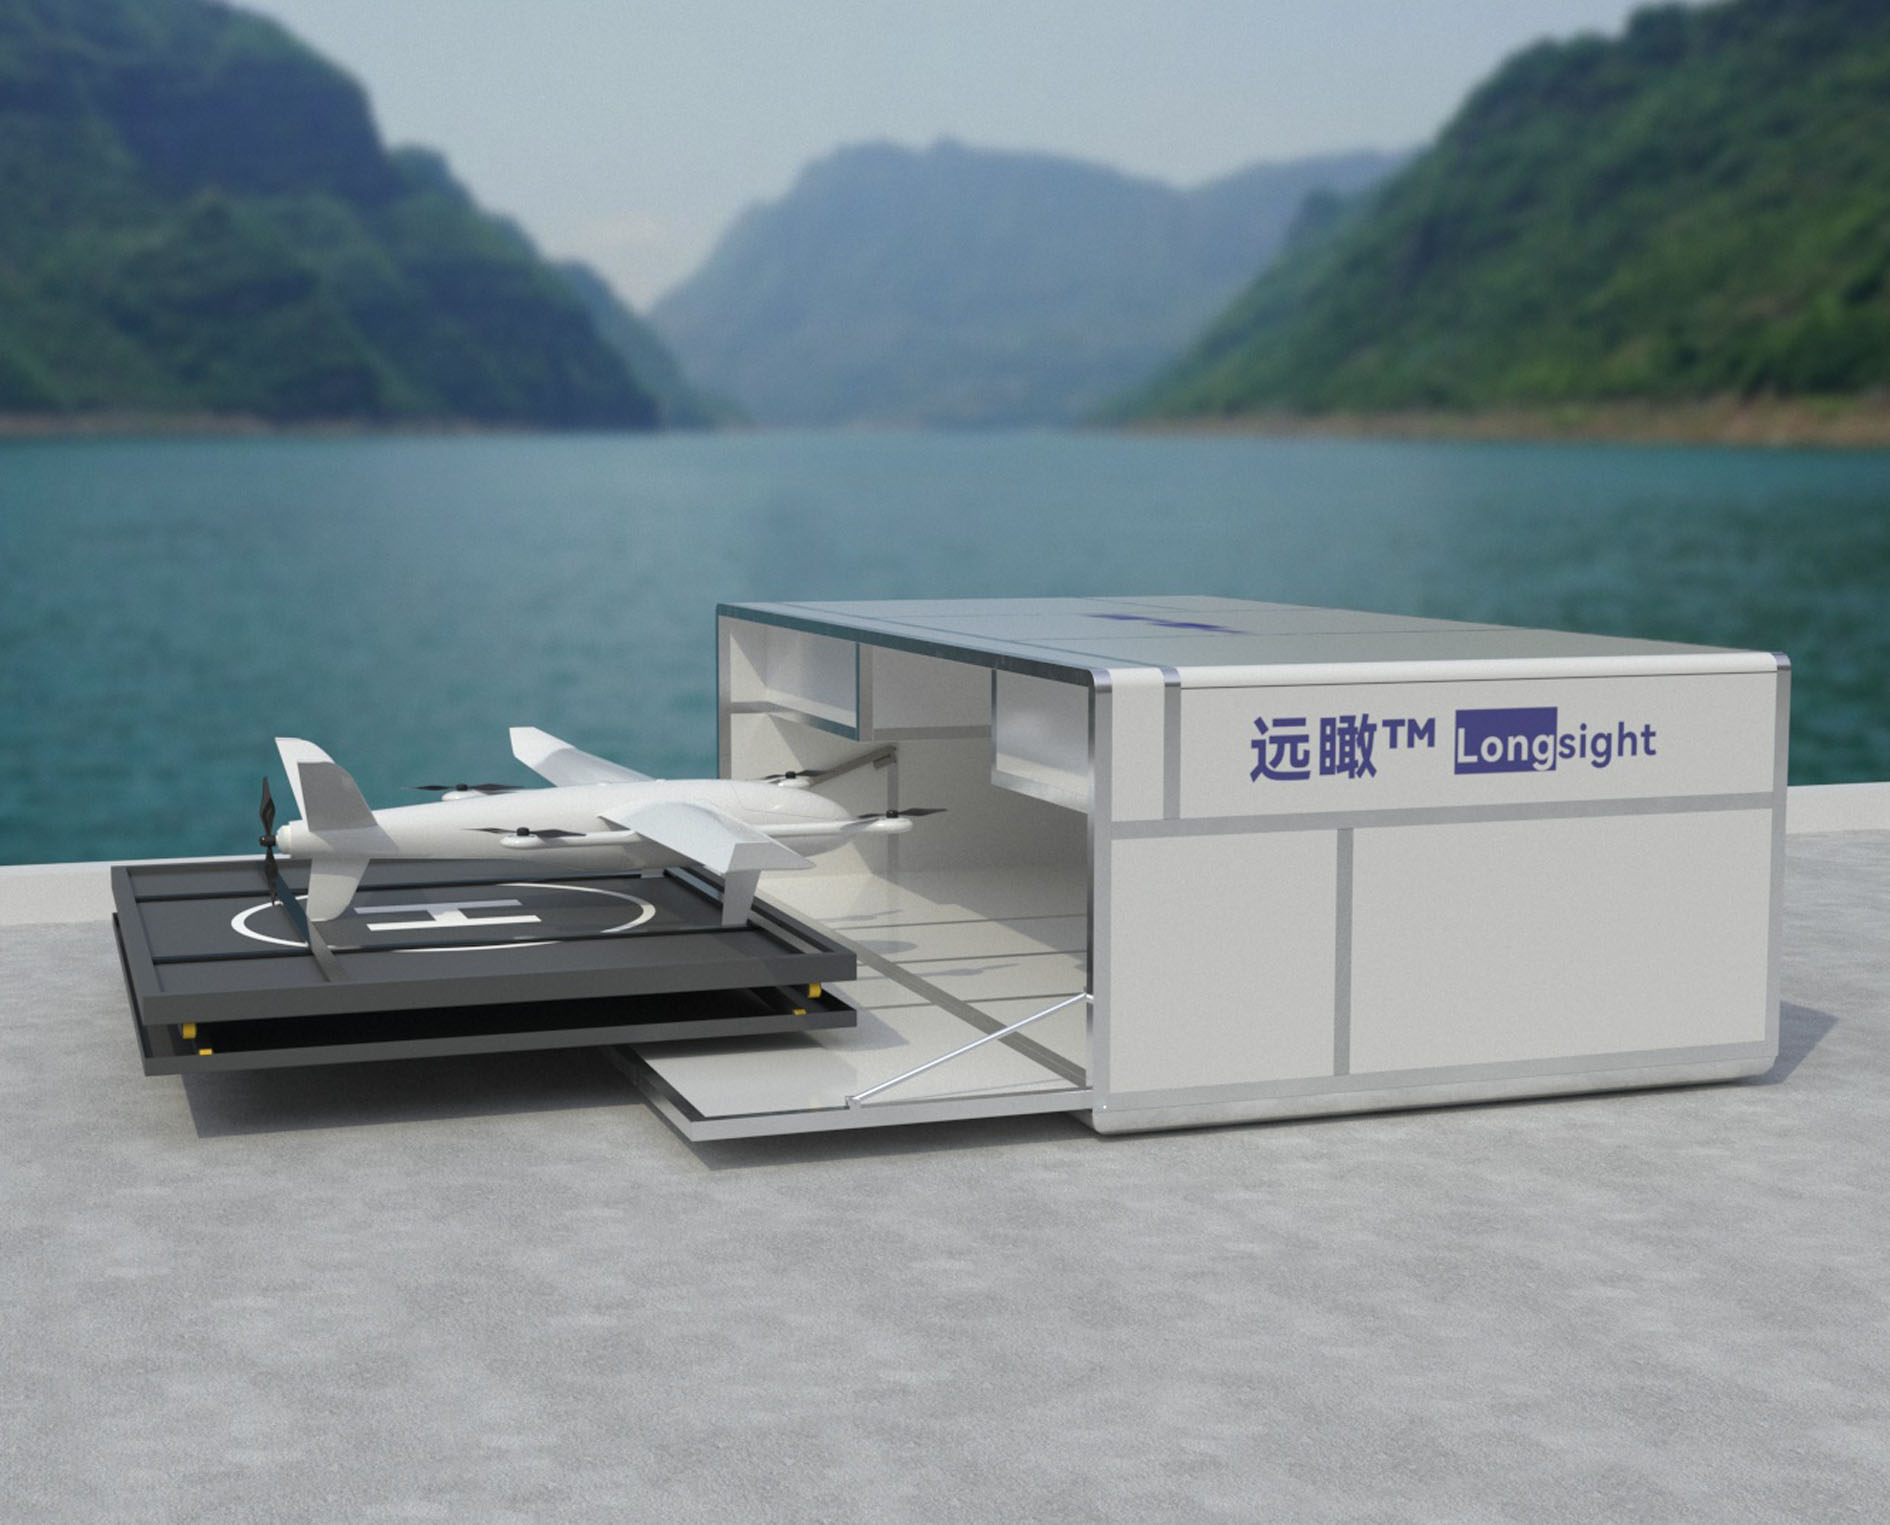 Farsightâą System
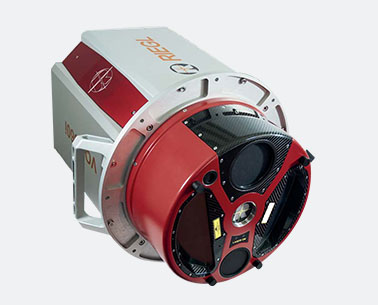 Riegl VQ-1560i
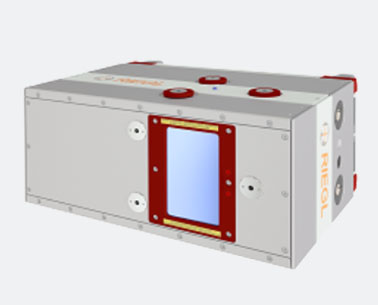 Riegl VQ-780II
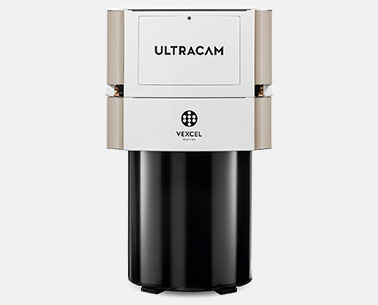 UltraCam Eagle M3
 Y-1 VTOL UAV
 Aerial Acquisition
 UAV Acquisition
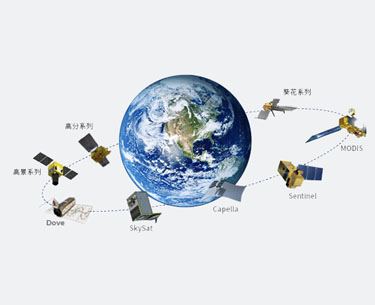 Satellite Acquisition
 Field Acquisition
 Integrated
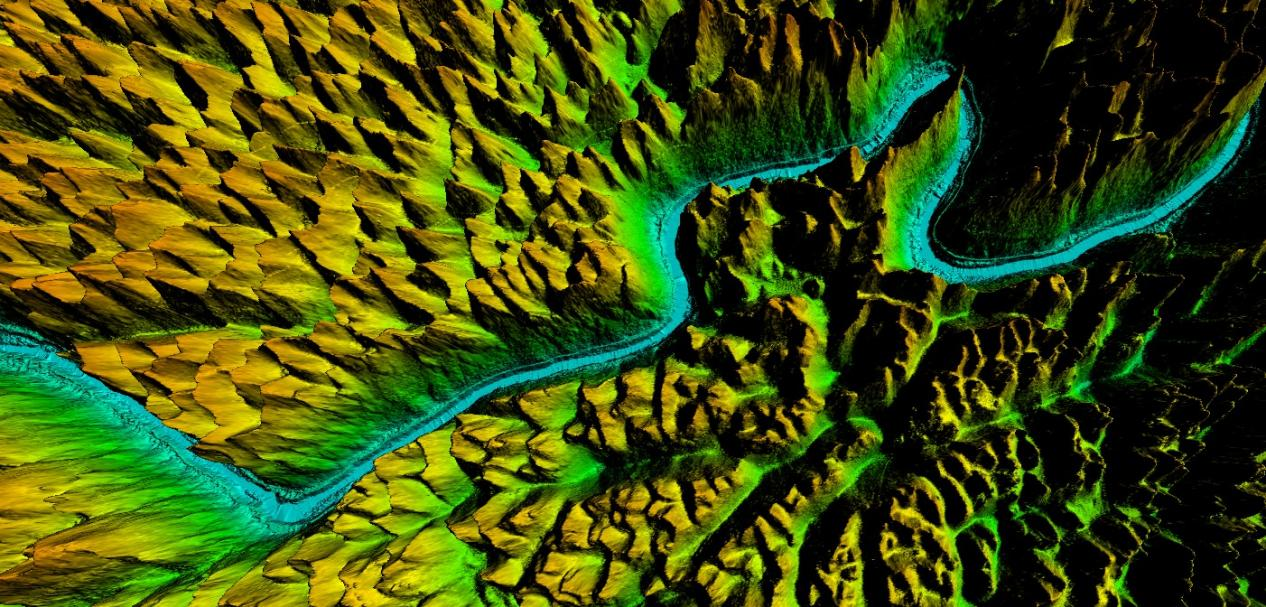
 LiDAR
LiDAR Orthophoto
 DEM
DEM DTM/DSM
 3D Mapping
 Topographic
 Infrared
 Feature Extraction
 BIM
BIM Transportation
 Water
Water power
power  Forestry
 Agriculture
 Mines & Quarries
 Heritage Buildings
 About feiyan
 Recognition
 Cases
Cases

search


Monitoring of Water Pollutants Through Aerial Remote Sensing
Mar 22, 2022
Aerial Remote sensing can monitor pollutant substances and detect water pollution problems in water areas through aerial Remote sensing; First to know about the Remote sensing, Remote sensing is to point to in the case of no direct contact with the target object, distance of target object detection, recognition and feature information, the process of electromagnetic waves, sound waves in space, gravity field can be used as a Remote sensing, but usually described in the Remote sensing refers to the use of electromagnetic waves for target feature information of Remote sensing of electromagnetic waves. Since any object with a temperature higher than absolute zero can emit, reflect or absorb energy radiation, and different objects have different properties and structures, different ground objects have their unique radiation characteristics. Similarly, in water environment monitoring, water bodies with different temperature, sediment content, algae quantity and pollution degree also have different radiation characteristics. Usually, the characteristics of various water bodies can be reflected by Remote sensing images. Polluted water has spectral characteristics different from clean water, which are reflected in the absorption or reflection of specific wavelength, and these spectral characteristics can be captured by Remote sensing devices and reflected in Remote sensing images. Based on the recognition of images, we can obtain water quality parameters or water pollution status. Based on this, Remote sensing technology can be applied in water environment monitoring.
With the rapid development of social economy and other aspects, the degree of water pollution in China's rivers, lakes and seas has been increasing, including domestic wastewater pollution, suspended solid pollution such as sediment, oil pollution, heavy metal pollution, eutrophication pollution and thermal pollution. According to the data provided by China environmental monitoring station, China's water environment faces three major problems:
â The discharge of major pollutants far exceeds the water environmental capacity;
âĄRivers and lakes are generally polluted;
âąLack of ecological water, water environment deterioration.
The current situation of water pollution indicates that the water environment pollution situation in China is serious, so it is imperative to improve the efficiency of water environment monitoring. The traditional method of water environment monitoring is mainly based on the sampling of ground distribution points, and then the laboratory analysis comes to the conclusion that this method has certain limitations due to the influence of natural conditions, space-time and other factors. For example, in the monitoring process of a large area of water, only relying on monitoring stations and traditional monitoring methods, it is difficult to meet the real-time, rapid, macro and accurate monitoring requirements for water pollution monitoring, thus failing to fully and accurately reflect water conditions. Compared with the traditional monitoring method, Remote sensing technology has the characteristics of macro, comprehensive, dynamic and fast, and can obtain information that cannot be obtained by other monitoring methods. The deterioration of water environment and the deficiency of traditional monitoring methods will promote the wide application of Remote sensing technology in water environment monitoring.
äžăCommon platforms and data for Remote sensing applications of water environment
In general, water environment monitoring mainly USES satellite Remote sensing and aerial Remote sensing platforms. The data mainly used include landsat-mss and TM data of the United States, spot-hrv data of France and various aerial Remote sensing data. In the 1970s and early 1980s, aerial Remote sensing was widely used to monitor phytoplankton in seawater. Remote sensing monitoring of water quality since the mid-1980s mainly USES satellite data and telemetry data from multi-spectral scanners and imaging spectrometers on space platforms. The commonly used data in Remote sensing monitoring of water environment can be classified into the following categories.
1.1Multispectral Remote sensing data
In Remote sensing monitoring of the water environment, commonly used multi-spectral Remote sensing data include image data of landsat-mss, TM, spot-hrv, noaa-avhrr, irs-liss, and ers-ops, as well as CCD camera data of the earth resources 1 (CBERS) satellite cooperated by China and Cuba. MSS data were first used to monitor the water quality of inland waters. For example, studies by Lathrop and Kloiber showed that the concentration of chlorophyll a and suspended matter in inland waters could be monitored by MSS data. Lathrop et al. conducted a series of Remote sensing studies on Green bay of Michigan lake in the United States, estimated a number of parameters including chlorophyll a, suspended solids and transparency, and obtained satisfactory results. Li xuwen et al. made a comprehensive analysis on the water quality of suzhou canal by using TM data. Yu fengning et al. used TM images to study the supervised classification of principal components in the water quality of northern taihu lake.
1.2Hyperspectral Remote sensing data
Existing hyperspectral data can be divided into two categories: imaging spectrometer data and non-imaging spectrometer data. AVIRIS data from the United States, CASI data from Canada, AISA data from Finland, PHI data from China, OMIS data, and SEAWIFS data were used for the imaging spectrometer data. A non-imaging spectrometer is a ground spectrograph that records information not for the purpose of image recording but in a non-image manner. For example, ASD field spectrometer, portable super spectrometer, etc. In the water quality monitoring of taihu lake in China, gre-1500 portable superspectrometer was used for surface spectral measurement.
1.3New and more advanced Remote sensing data
In fact, the new Remote sensing data is no more than multi-spectral and hyperspectral Remote sensing data, but the new satellite launch provides the Remote sensing data with higher space, time and spectral resolution for the Remote sensing monitoring of the water environment. Such as ETM+, MERIS multispectral data, Hyperion, MODIS hyperspectral data. The application of new satellite Remote sensing data in water environment monitoring is still in its infancy at home and abroad. MODIS is the main detection instrument of eos-am1 series satellites, belonging to a class of hyperspectral sensors with discontinuous band (spectral range 0.4 ~ 14.5 nm), small number (36 bands) and low ground resolution. Its spatial resolution is 250m, 500m and 1000m, and global observation data can be obtained once a day or every two days, which is suitable for large-scale dynamic monitoring.
äșăSpectral characteristics of water bodies
Since Remote sensing measures the reflected radiation of ground objects, we study the spectral characteristics of water by using the spectral characteristic curve of reflection wave. The spectral characteristic curve of reflection wave refers to the law that the reflectivity (or reflected radiant energy) of an object changes with the wavelength, which is obtained by taking the wavelength as the abscissa and the reflectance as the ordinate.
2.1Spectral characteristics of natural water bodies
The reflection of natural water is mainly in the blue-green light band, and the absorption rate of other bands is very strong. In particular, there are strong absorption bands in the near-infrared and mid-infrared bands, and the reflectance is almost zero, so it is easy to identify water in the infrared band. The spectral reflectance of cleaner natural water in the band 0.4 ~ 1.1 m is about 1% ~ 3%, and its average reflectance is about 2%. But when there is something else in the water, the reflectance curve changes. When sediment is contained, the emissivity of visible band will increase due to the scattering effect of sediment, and the peak value will appear in the yellow and red area. When chlorophyll is contained in water, the near infrared band rises obviously. Turbid water, caused by sediment, natural organisms and plankton, usually has a higher spectral reflectance than clear water. Studies have shown that the spectral reflectance of turbidified river water (containing 99mg/L of suspended matter) is 1.5% ~ 6% higher than that of clear lake water (containing 10mg/L of suspended matter). These are important data for impact analysis.
2.2Spectral characteristics of polluted water
The types of pollutants are different, and their physical and chemical properties are not the same, so they have different effects on the spectral reflectance of water. The reflectance of polluted water with more suspended substances of black and dark materials is slightly lower than that of clean natural water at the band 0.4 ~ 1.1cm. The reflectance of water with more suspended pollutants in medium color is higher than that of clean water. However, the reflectance of water with more suspended pollutants in light and white colors is significantly higher than that of clean natural water at the band 0.4 ~ 1.1 km.
äžăPrinciple and method of monitoring water quality parameters by Remote sensing
The principle of monitoring water quality parameters by Remote sensing is that polluted water or water containing a certain substance has unique spectral characteristics different from clean water. Water components, such as suspended solids, algae, chemicals and dissolved organic matter, are reflected in Remote sensing images because they affect the reflection, absorption and backscattering of light, so that water quality parameters can be inferred from their reflection in images. Figure 3 shows the reflection spectra of different types of inland water bodies. It can be seen that the difference in water component content results in significant differences in reflectance in a certain wavelength range, which serves as the basis for quantitative measurement of material content.
The water quality parameters monitored by Remote sensing technology can be roughly divided into the following four categories: turbidity, phytoplankton, dissolved organic matter and chemical water quality index. There are usually three methods: theoretical method, semi-empirical method and empirical method.
3.1Theoretical method
Based on the theoretical model of light field in water, the relationship between the ratio of absorption coefficient to backscatter coefficient and surface reflectance is determined. Then, the reflectivity value can be measured by Remote sensing. Finally, it is connected with the characteristic absorption coefficient and backscattering coefficient of the components in water, and the ratio of the actual absorption coefficient to the backscattering coefficient in water is calculated to obtain the content of the components. The model based on the light field theory is not perfect yet, and the simplified hypothesis model makes the predicted value unable to meet the accuracy requirements.
Based on the statistical analysis of correlation between Remote sensing band data and ground measured data, this method selects the optimal band or combination of band data and ground measured water quality parameters, obtains the relevant model through statistical analysis, and then USES this model to invert water quality parameters. The defect of this method is that the factual correlation between water quality parameters and Remote sensing data cannot be guaranteed.
3.2Semiempirical method
The semi-empirical method is the most commonly used method, which combines the known spectral characteristics of water parameters with the relevant statistical model. Many scholars at home and abroad use this method to monitor the water quality parameters of lakes and reservoirs, such as total suspended matter, chlorophyll, and related transparency, turbidity and eutrophication index, etc., and obtain higher monitoring accuracy.

ćăApplication of Remote sensing in water environment pollution monitoring and control
The application of Remote sensing in water environment pollution monitoring and control is based on the acquisition of water quality parameters by Remote sensing technology. The research work in this field is mainly carried out in Marine environment and inland water environment. Satellite Remote sensing enables large-scale, all-weather pollution monitoring of the ocean. For example, multi-spectral sensors can be used to monitor oil pollution. In the process of monitoring the inland water environment, due to the complexity of the spectral characteristics of the inland water, the current research scope is relatively small, mainly in lakes and river estuaries, and the water quality parameters that can be monitored are also less, mainly focusing on chlorophyll, suspended matter, total phosphorus, total nitrogen, COD, BOD, etc. In order to study various kinds of water pollution with Remote sensing method, it is not necessary to distinguish various applications of Remote sensing in Marine and inland water pollution monitoring and control in detail. Instead, it is customary to divide Remote sensing into water eutrophication, sediment pollution, thermal pollution, waste water pollution, oil pollution and other types.
4.1Eutrophication of water
When a large amount of nutrient salt enters the water body, it will cause the algae to multiply in a large number under certain conditions, and then consume a large amount of dissolved oxygen in the process of algal death and decomposition, resulting in the death of fish and shellfish. This process is called eutrophication of water body. Chlorophyll is the most important factor reflecting the eutrophication degree of water, among which chlorophyll a is the most prominent. Through the sampling of chlorophyll biomass and other data, a Remote sensing regression model was established by using the green index of water reflected by the sampling data and Remote sensing data, and the spatial distribution information of chlorophyll and biomass in water was obtained, so as to achieve the purpose of monitoring eutrophication of water. For the estimation of water chlorophyll concentration by Remote sensing, domestic and foreign scholars have done a lot of research, and established many mathematical models between Remote sensing data and water spectra with different chlorophyll concentrations. For example, empirical algorithm based on regression model, neural network model method, spectral mixed analysis method, etc. However, due to the relatively weak spectral signal of chlorophyll in water and the influence of suspended solid content in water, the accuracy of Remote sensing estimation of chlorophyll content in water is not high at present, with an average relative error of about 20% ~ 30%.
4.2Sediment pollution
Sediment in water can change the spectral characteristics of water. In practical work, the bands with good correlation with sediment concentration are selected to analyze with the results of field survey of suspended solids, and the corresponding relationship model between the radiation value of a specific band and the concentration of suspended solids is established. Then, the concentration of suspended solids can be obtained by inversion of the radiation value of this band. In the band 058 ~ 068 ° m of visible light, the radiation peaks appear at different sediment concentrations, which is the best band for monitoring water sediment by Remote sensing. These models mainly include Gordon formula model, negative exponential relational model, unified relational model and other theoretical models, linear relational model, logarithmic relational model, multi-band relational model and other empirical models.
Many domestic and foreign scholars have conducted long-term studies on how to extract special information on sediment by using water spectral data obtained by Remote sensing. Kritilos et al. were the first to use landsat data to study the content of suspended solids in water. Li jing et al. established a negative index model between reflectivity and suspended matter content, which was applied to the investigation of suspended matter in hangzhou bay waters. Li yan et al. studied the Remote sensing algorithm of suspended sediment based on the spectral reflectance slope transfer phenomenon of sea-surface remote sensor.
4.3Thermal pollution
When the cooling water used in the electric power, steel and chemical industries is discharged into rivers, lakes and seas in excess of the permitted hot water discharge standard, the temperature of the natural water body rises and changes in the physical, chemical and biological processes of the water body result in thermal pollution. At present, the main methods of monitoring water thermal pollution by Remote sensing include thermal infrared Remote sensing and microwave Remote sensing.
Thermal pollution can be detected by thermal infrared sensors, which can show the emission, flow direction and temperature distribution of thermal pollution by using multi-phase thermal infrared images combined with ground observation. By using optical technology or computer to segment the image density, the water temperature distribution curve can be drawn exactly according to a small amount of synchronous measurement of water temperature.
For example, the relevant departments have analyzed and studied the thermal pollution status of the entire length of the haihe river at 79km, and identified 23 sources of thermal pollution, 40 thermal discharge outlets and a total discharge of hot water of about 850 million tons per year, and divided the river into non-thermal pollution, mild thermal pollution, moderate thermal pollution, severe thermal pollution and severe thermal pollution.
4.4Water pollution
Because of the different properties of wastewater, the reflection position and intensity on the characteristic curve are different. The ratio between pollutant content and which wave bands has a good correlation, which depends on the pollution nature and pollution degree of water. The waste water pollution is usually monitored by multi-spectral synthetic image, but can also be measured by thermal infrared method according to the temperature difference.
As a result of human production and living activities, a large amount of waste water flows into various kinds of water bodies, which contains a large amount of organic matter, consumes a large amount of oxygen during decomposition, and has high COD and BOD values. Using infrared sensors can be according to the water contain substances such as dyes, hydrogen and oxygen compounds infrared radiation spectrum of figuring out the situation of water pollution, pollution condition on color infrared photo has a very good show, not only can directly observe pollutant migration, but also with the water and sediment suspension and phytoplankton as interpretation indicators to track the sources of pollution.
In June 2001, a spectral test was conducted on 8 sewage with different pollution levels in xi 'an city moat and xingqing park, and a correlation model between water reflection spectra, BOD5 and COD content was established, and good results were obtained. Ma yueliang et al. used TM image data to study the monitoring application of water pollution in the water environment quality of guangzhou reach of the pearl river and established a Remote sensing model for water pollution prediction.
4.5 Oil pollution
Petroleum pollution refers to the pollution caused by crude oil and various petroleum products entering the environment during the exploitation, refining, storage, transportation and use of petroleum. At present, the pollution of oil to the sea has become a serious problem in the world.
Remote sensing survey of oil pollution can not only discover the extent of known contaminated areas and estimate the content of contaminated oil, but also trace the source of pollution. There are many ways to control oil pollution.
(1)The reflectance of oil in visible light band 0.3 ~ 0.4 ° m is relatively weak, so it can be used to monitor oil pollution. In addition, in visible light band 0.63 ~ 0.68 ° m, the contrast between the oil film and the surrounding clean seawater can reach the maximum. Therefore, the red band can also be used to monitor the oil film on the sea surface, while the blue band can be used to distinguish the oil film, track and mud plume, so as to achieve the best effect of the multi-band visible light aerial remote oil measurement.
(2)The oil film is white in the ultraviolet photo, and the ultraviolet light band is sensitive to various water surface oil films with thickness less than 5mm. At this point, the reflectivity of the oil film to ultraviolet light is 1.2 ~ 1.8 times higher than that of seawater, with better brightness contrast. Therefore, the thin oil film on the sea surface can be shown by the ultraviolet wave wave.
(3)At room temperature, the water pollution and water surface oil film reflectivity is different, thermal infrared pictures without pollution on the water with a white stripe, row oil in black stripe, the oil film dark tonal, thus it can be use of thermal infrared Remote sensing to monitoring of oil pollution, according to different gray scale, the other can calculate the content of oil cover.
(4)Oil pollution can also be detected by microwave radiometer imaging with a wavelength of 2.2cm.
äșăThe application trend of Remote sensing in water environment
Water environment problem is an important environmental problem at present, because of the advantages of Remote sensing technology over traditional methods, it will undoubtedly promote the development and extensive application of Remote sensing technology in water environment. However, it can be seen from the previous discussion that there are still many problems in the application of Remote sensing technology in water environment, which need further research. In general, the application of Remote sensing technology in water environment will develop in the following direction.
(1)Image acquisition technology continues to evolve. Satellite images are developing towards high spatial resolution and high spectral resolution.
(2)The model method of monitoring water quality parameters by Remote sensing has been improved constantly. Further study on the theoretical relationship between water quality parameters, intrinsic optical characteristics and surface reflectance makes the algorithm not limited to specific time and water area, which is an effective way to improve the accuracy of water quality monitoring under the circumstance that Remote sensing data sources cannot be improved soon.
(3)The expansion of water quality parameter monitoring project. On the basis of constantly improving the monitoring of parameters such as chlorophyll, suspended solids and temperature, it is necessary to develop theoretical methods and models for Remote sensing monitoring of important parameters such as COD and BOD.
(4)The comprehensive application of 3S technology in water environment monitoring and the establishment of water environment <a target="_blank" hre


-
 Oct 31, 2021
We participated in the infrastructure construction of the national parks
In order to protect biodiversity and promote the sustainable development of mankind, China formally established the first batch of national parks on October 12, 2021. More > -
Mar 22, 2022
Aviation Remote Sensing Surveying and Mapping
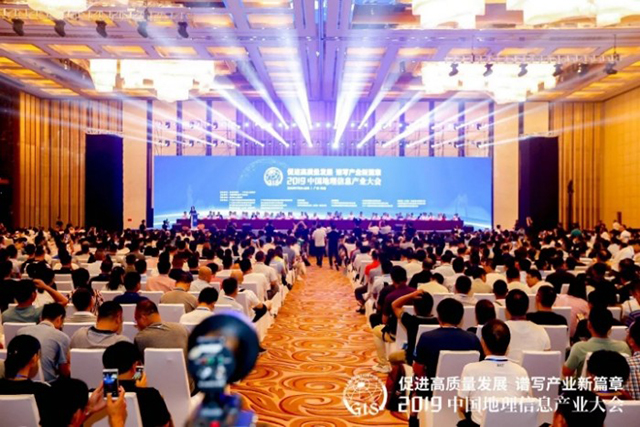
Is obtained by the industry news: the Chinese national geographic information bureau of surveying and mapping said 2018 will accelerate the construction of aerospace Remote sensing mapping, through high score 7 satellite launch preparation, promote resource 03 star project no. 3, 4 star, the construction of domestic satellite receiving station and overseas processing system, promote new platforms such as drones, and airborne laser radar is a new application of sensor, gradually formed multi-resolution, multi-type, multi-sensor, all-weather comprehensive efficient aerospace Remote sensing mapping ability. This marks the arrival of the era of aviation Remote sensing surveying and mapping, and China will accelerate the construction of aviation Remote sensing surveying and mapping. More > -
Mar 22, 2022
3S Technology Application Status
RS, GPS and GIS technology, referred to as More > -
Mar 22, 2022
Feiyan Remote Sensing Organized Comprehensive and Systematic Training to Improve the Professional
Recently, feiyan Remote sensing held a large-scale employee training in the headquarters, invited the directors of each branch to participate in the training, and organized the examination. More > -
Mar 22, 2022
Feiyan Remote Sensing Won the Award of
With the theme of More > -
Mar 22, 2022
Feiyan Remote Sensing Training an Important Role in Ensuring the Completion of Aerial Photography
In the previous article More > -
Mar 22, 2022
Remote Sensing Applications Usher in a New Blue Ocean
Recently, at the second forum on Remote sensing application technology held in Beijing, China's autonomous Remote sensing image processing software has made great progress. More > -
Mar 22, 2022
How to use aerial remote sensing to monitor pests and diseases?
Airborne LiDAR Aerial photography can be used to analyze the degree of pests and diseases of crops or forest trees based on the laser reflection intensity of crops or forest trees; Aerial imagery can also be used to analyze the effects of crops or forest trees based on the spectral characteristics of crops or forest trees. Degree of pests and diseases. More > -
Mar 22, 2022
We won the 2021 National Excellent Surveying and Mapping Project Bronze Award
A project calledâAcquisition and Processing of Airborne Lidar Data for Guangxi Forest Resources Planning and Design Surveyâ won the National Excellent Surveying and Mapping Project Bronze Award in 2021 by Feiyan Remote Sensing. More >